3. Image simulation with dask and generat#
The purpose here is to simulate images to identify the best methods for:
Determining the FLAT image
Segmenting cells from the background
Computing the ratio
Determine the minimal detectable gradient for a given error.
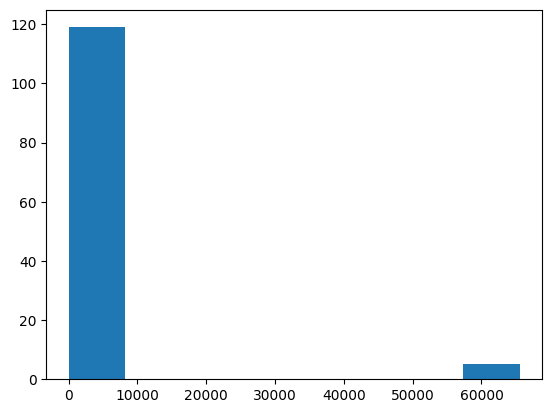
Since subtracting the correct background value is crucial for accurate ratio imaging, we will test the distribution of background values with probplot for normality.
[1]:
%load_ext autoreload
%autoreload 2

import numpy as np
import scipy
import pandas as pd
import matplotlib.pyplot as plt
import tifffile as tff
import skimage
import skimage.io
import skimage.filters
import zarr
from scipy import ndimage
import dask.array as da
import dask_image
from dask_image import ndfilters
from dask_image import ndmorph

from nima import nima
from nima import utils

store = tff.imread("/home/dati/dt-clop3/data/210920/flatxy.tf8", aszarr=True)

zc1a = zarr.open(store)
zc1a.info
---------------------------------------------------------------------------
FileNotFoundError                         Traceback (most recent call last)
/tmp/ipykernel_823/1246610699.py in ?()
     18
     19 from nima import nima
     20 from nima import utils
     21
---> 22 store = tff.imread("/home/dati/dt-clop3/data/210920/flatxy.tf8", aszarr=True)
     23
     24 zc1a = zarr.open(store)
     25 zc1a.info

~/checkouts/readthedocs.org/user_builds/nima/envs/tut2/lib/python3.11/site-packages/tifffile/tifffile.py in ?(files, aszarr, key, series, level, squeeze, maxworkers, mode, name, offset, size, pattern, axesorder, categories, imread, sort, container, chunkshape, dtype, axestiled, ioworkers, chunkmode, fillvalue, zattrs, multiscales, omexml, out, out_inplace, _multifile, _useframes, **kwargs)
   1036
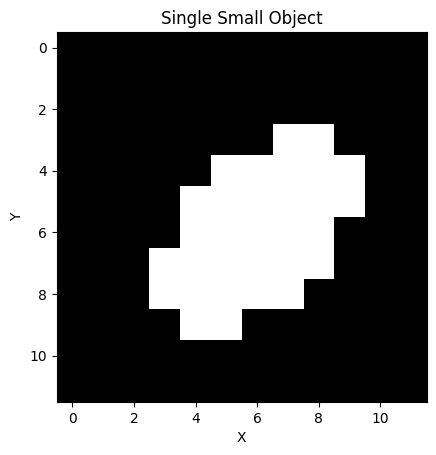
   1037         if isinstance(files, str) or not isinstance(
   1038             files, collections.abc.Sequence
   1039         ):
-> 1040             with TiffFile(
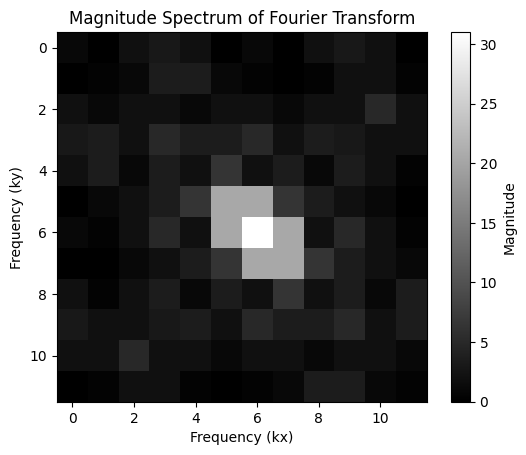
   1041                 files,
   1042                 mode=mode,
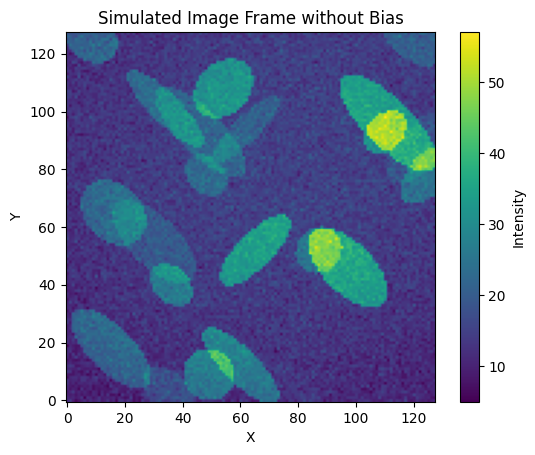
   1043                 name=name,

~/checkouts/readthedocs.org/user_builds/nima/envs/tut2/lib/python3.11/site-packages/tifffile/tifffile.py in ?(self, file, mode, name, offset, size, omexml, _multifile, _useframes, _parent, **is_flags)
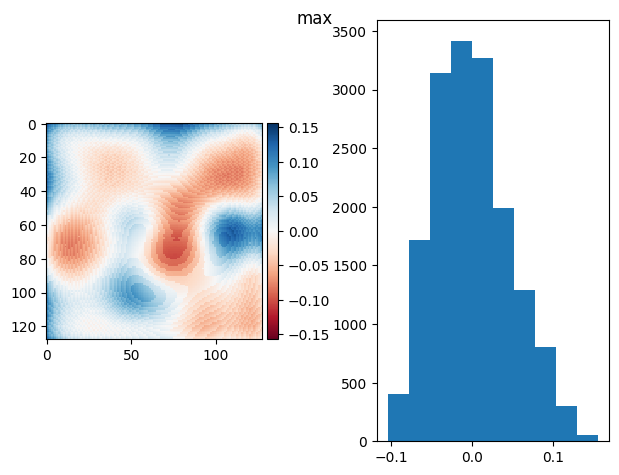
   3929
   3930         if mode not in (None, 'r', 'r+', 'rb', 'r+b'):
   3931             raise ValueError(f'invalid mode {mode!r}')
   3932
-> 3933         fh = FileHandle(file, mode=mode, name=name, offset=offset, size=size)
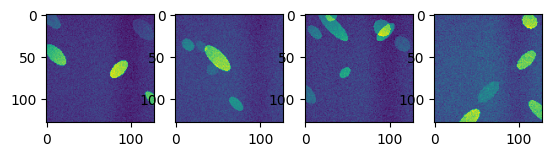
   3934         self._fh = fh
   3935         self._multifile = True if _multifile is None else bool(_multifile)
   3936         self._files = {fh.name: self}

~/checkouts/readthedocs.org/user_builds/nima/envs/tut2/lib/python3.11/site-packages/tifffile/tifffile.py in ?(self, file, mode, name, offset, size)
  13631         self._offset = -1 if offset is None else offset
  13632         self._size = -1 if size is None else size
  13633         self._close = True
  13634         self._lock = NullContext()
> 13635         self.open()
  13636         assert self._fh is not None

~/checkouts/readthedocs.org/user_builds/nima/envs/tut2/lib/python3.11/site-packages/tifffile/tifffile.py in ?(self)
  13646         if isinstance(self._file, str):
  13647             # file name
  13648             self._file = os.path.realpath(self._file)
  13649             self._dir, self._name = os.path.split(self._file)
> 13650             self._fh = open(self._file, self._mode)  # type: ignore
  13651             self._close = True
  13652             if self._offset < 0:
  13653                 self._offset = 0

FileNotFoundError: [Errno 2] No such file or directory: '/home/dati/dt-clop3/data/210920/flatxy.tf8'
[2]:
dd = da.from_zarr(store)
dd
---------------------------------------------------------------------------
NameError                                 Traceback (most recent call last)
Cell In[2], line 1
----> 1 dd = da.from_zarr(store)
      2 dd

NameError: name 'store' is not defined
[3]:
img = dd[0, 0]
plt.imshow(img, vmax=60)
---------------------------------------------------------------------------
NameError                                 Traceback (most recent call last)
Cell In[3], line 1
----> 1 img = dd[0, 0]
      2 plt.imshow(img, vmax=60)

NameError: name 'dd' is not defined
[4]:
bg, bgs, bgfigs = nima.bg(img.compute())
---------------------------------------------------------------------------
NameError                                 Traceback (most recent call last)
Cell In[4], line 1
----> 1 bg, bgs, bgfigs = nima.bg(img.compute())

NameError: name 'img' is not defined
[5]:
bg, utils.bg(img.compute())
---------------------------------------------------------------------------
NameError                                 Traceback (most recent call last)
Cell In[5], line 1
----> 1 bg, utils.bg(img.compute())

NameError: name 'bg' is not defined
[6]:
plt.figure(figsize=(8, 4))
plt.subplot(1, 2, 1)
plt.hist(bgs, bins=20)
plt.subplot(1, 2, 2)
scipy.stats.probplot(
    bgs,
    plot=plt,
    rvalue=1,
)
---------------------------------------------------------------------------
NameError                                 Traceback (most recent call last)
Cell In[6], line 3
      1 plt.figure(figsize=(8, 4))
      2 plt.subplot(1, 2, 1)
----> 3 plt.hist(bgs, bins=20)
      4 plt.subplot(1, 2, 2)
      5 scipy.stats.probplot(
      6     bgs,
      7     plot=plt,
      8     rvalue=1,
      9 )

NameError: name 'bgs' is not defined
[7]:
pp = da.mean(
    dask_image.ndfilters.maximum_filter(dd[0:4000:20, 0], size=(100, 1, 1)), axis=0
)
---------------------------------------------------------------------------
NameError                                 Traceback (most recent call last)
Cell In[7], line 2
      1 pp = da.mean(
----> 2     dask_image.ndfilters.maximum_filter(dd[0:4000:20, 0], size=(100, 1, 1)), axis=0
      3 )

NameError: name 'dd' is not defined
[8]:
ppp = pp.compute()

plt.imshow(skimage.filters.gaussian(ppp, 100))
---------------------------------------------------------------------------
NameError                                 Traceback (most recent call last)
Cell In[8], line 1
----> 1 ppp = pp.compute()
      3 plt.imshow(skimage.filters.gaussian(ppp, 100))

NameError: name 'pp' is not defined
[9]:
m = img < skimage.filters.threshold_mean(img)
skimage.filters.threshold_mean((img * m).clip(np.min(img))).compute()
---------------------------------------------------------------------------
NameError                                 Traceback (most recent call last)
Cell In[9], line 1
----> 1 m = img < skimage.filters.threshold_mean(img)
      2 skimage.filters.threshold_mean((img * m).clip(np.min(img))).compute()

NameError: name 'img' is not defined
[10]:
plt.imshow(img < skimage.filters.threshold_triangle(img))
---------------------------------------------------------------------------
NameError                                 Traceback (most recent call last)
Cell In[10], line 1
----> 1 plt.imshow(img < skimage.filters.threshold_triangle(img))

NameError: name 'img' is not defined
[11]:
from dask_image import ndmorph


def dabg(di):
    m = di < skimage.filters.threshold_mean(di)
    m1 = di < skimage.filters.threshold_mean((di * m).clip(np.min(di)))
    m2 = ndmorph.binary_dilation(~m1)
    return da.ma.masked_array(di, mask=~m1)
[12]:
def bg(im):
    m = im < skimage.filters.threshold_mean(im)
    m1 = im < skimage.filters.threshold_mean((im * m).clip(np.min(im)))
    m2 = skimage.morphology.binary_dilation(~m1, footprint=np.ones([1, 1]))
    # m2 = im < skimage.filters.threshold_triangle(np.ma.masked_array(im, mask=~m))
    return np.ma.masked_array(im, mask=m2)
[13]:
dabg(img).compute()
---------------------------------------------------------------------------
NameError                                 Traceback (most recent call last)
Cell In[13], line 1
----> 1 dabg(img).compute()

NameError: name 'img' is not defined
[14]:
flat = np.ma.mean(dabg(dd[333:500:1, 0]).compute(), axis=0)
---------------------------------------------------------------------------
NameError                                 Traceback (most recent call last)
Cell In[14], line 1
----> 1 flat = np.ma.mean(dabg(dd[333:500:1, 0]).compute(), axis=0)

NameError: name 'dd' is not defined
[15]:
skimage.io.imshow(flat)
---------------------------------------------------------------------------
NameError                                 Traceback (most recent call last)
Cell In[15], line 1
----> 1 skimage.io.imshow(flat)

NameError: name 'flat' is not defined
3.1. threshold mean clipping to min()#
[16]:
skimage.io.imshow(bg(dd[0, 0]))
---------------------------------------------------------------------------
NameError                                 Traceback (most recent call last)
Cell In[16], line 1
----> 1 skimage.io.imshow(bg(dd[0, 0]))

NameError: name 'dd' is not defined
[17]:
plt.hist(bg(img).ravel())
---------------------------------------------------------------------------
NameError                                 Traceback (most recent call last)
Cell In[17], line 1
----> 1 plt.hist(bg(img).ravel())

NameError: name 'img' is not defined
[18]:
[np.ma.median(bg(dd[i, 0])) for i in range(10)]
---------------------------------------------------------------------------
NameError                                 Traceback (most recent call last)
Cell In[18], line 1
----> 1 [np.ma.median(bg(dd[i, 0])) for i in range(10)]

Cell In[18], line 1, in <listcomp>(.0)
----> 1 [np.ma.median(bg(dd[i, 0])) for i in range(10)]

NameError: name 'dd' is not defined
[19]:
%%time
utils.bg(img.compute(), bgmax=40)
---------------------------------------------------------------------------
NameError                                 Traceback (most recent call last)
File <timed eval>:1

NameError: name 'img' is not defined
[20]:
%%time
np.ma.mean(bg(img.compute()))
---------------------------------------------------------------------------
NameError                                 Traceback (most recent call last)
File <timed eval>:1

NameError: name 'img' is not defined
[21]:
%%time
utils.bg2(img.compute(), bgmax=60)
---------------------------------------------------------------------------
NameError                                 Traceback (most recent call last)
File <timed eval>:1

NameError: name 'img' is not defined
[22]:
utils._bgmax(img.compute(), step=0.1)
---------------------------------------------------------------------------
NameError                                 Traceback (most recent call last)
Cell In[22], line 1
----> 1 utils._bgmax(img.compute(), step=0.1)

NameError: name 'img' is not defined
[23]:
utils.pbar.unregister()
3.2. masked array (ma)#
[24]:
a = np.ma.masked_array([1, 4, 3], mask=[False, False, True])
b = np.ma.masked_array([10, 2, 6], mask=[False, True, False])

np.ma.median([a, b], axis=0)
[24]:
masked_array(data=[5.5, 3. , 4.5],
             mask=False,
       fill_value=1e+20)
[25]:
np.ma.median(np.ma.stack([a, b]), axis=0)
[25]:
masked_array(data=[5.5, 4.0, 6.0],
             mask=[False, False, False],
       fill_value=1e+20)
[26]:
img
---------------------------------------------------------------------------
NameError                                 Traceback (most recent call last)
Cell In[26], line 1
----> 1 img

NameError: name 'img' is not defined
[27]:
f3 = img > skimage.filters.threshold_local(img.compute(), 601)
---------------------------------------------------------------------------
NameError                                 Traceback (most recent call last)
Cell In[27], line 1
----> 1 f3 = img > skimage.filters.threshold_local(img.compute(), 601)

NameError: name 'img' is not defined
[28]:
f3
---------------------------------------------------------------------------
NameError                                 Traceback (most recent call last)
Cell In[28], line 1
----> 1 f3

NameError: name 'f3' is not defined
[29]:
img[~f3].mean().compute()
---------------------------------------------------------------------------
NameError                                 Traceback (most recent call last)
Cell In[29], line 1
----> 1 img[~f3].mean().compute()

NameError: name 'img' is not defined
[30]:
m1 = np.ma.masked_greater(img, 15)
---------------------------------------------------------------------------
NameError                                 Traceback (most recent call last)
Cell In[30], line 1
----> 1 m1 = np.ma.masked_greater(img, 15)

NameError: name 'img' is not defined
3.2.1. generat#
[31]:
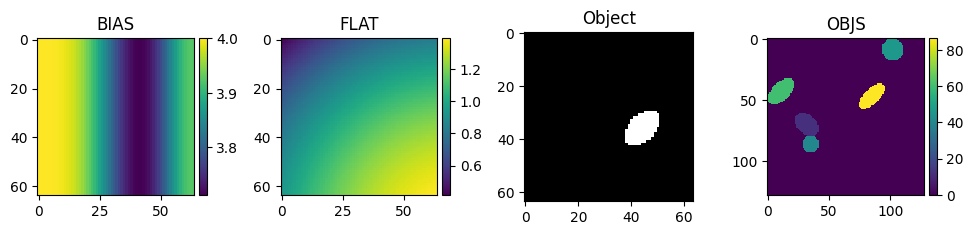
image = "bias + noise + dark + flat * (sky + obj)"
[32]:
image
[32]:
'bias + noise + dark + flat * (sky + obj)'
bias: generate a wave-like shape along x.
noise: random number will do.
dark: simply a scalar value.
flat: generate some 2D parabolic shape.
obj: circles-ellipsis. (MAYBE: like finite fractals to compare segmentation).
sky: None | some blurred circle-ellipsoid coincident and not with some obj.
fg_prj :=
bg_prj :=
[33]:
from nima import generat
[34]:
plt.figure(figsize=(12, 2.8))
plt.subplot(1, 5, 1)
plt.title("BIAS")
skimage.io.imshow(generat.gen_bias(64, 64))
plt.subplot(1, 5, 2)
plt.title("FLAT")
skimage.io.imshow(generat.gen_flat(64, 64))
plt.subplot(1, 5, 3)
plt.title("Object")
skimage.io.imshow(generat.gen_object(64, 64, max_radius=7))
plt.subplot(1, 5, 4)
plt.title("OBJS")
skimage.io.imshow(
    generat.gen_objs(
        100,
        30,
        max_radius=12,
        min_radius=6,
    )
)
/home/docs/checkouts/readthedocs.org/user_builds/nima/envs/tut2/lib/python3.11/site-packages/skimage/io/_plugins/matplotlib_plugin.py:149: UserWarning: Float image out of standard range; displaying image with stretched contrast.
  lo, hi, cmap = _get_display_range(image)
[34]:
<matplotlib.image.AxesImage at 0x7f5dc3ded290>
[35]:
objs = generat.gen_objs(15, 20, max_radius=12, min_radius=6, ncols=64, nrows=64)
frame = generat.gen_frame(objs, None, None, dark=10, sky=0, noise_sd=6)

bg, bgs, bgfigs = nima.bg(frame.astype("float"))
plt.hist(bgs, bins=8)
bg
[35]:
11.0
[36]:
bg_arcsinh = []
bg_entropy = []
bg_adaptive = []
bg_liadaptive = []
bg_lili = []
bg_utils = []
bg2_utils = []

for _ in range(25):
    objs = generat.gen_objs(150, 60, max_radius=12, min_radius=6, ncols=64, nrows=64)
    frame = generat.gen_frame(objs, None, None, dark=10, sky=0, noise_sd=2)
    bg_arcsinh.append(nima.bg(frame.astype("float"), kind="arcsinh")[0])
    # bg_entropy.append(nima.bg(frame, kind='entropy')[0])
    bg_adaptive.append(nima.bg(frame, kind="adaptive")[0])
    bg_liadaptive.append(nima.bg(frame, kind="li_adaptive")[0])
    bg_lili.append(nima.bg(frame, kind="li_li")[0])
    bg_utils.append(utils.bg(frame)[0])
    bg2_utils.append(utils.bg2(frame)[0])
/home/docs/checkouts/readthedocs.org/user_builds/nima/envs/tut2/lib/python3.11/site-packages/nima/utils.py:98: RuntimeWarning: Number of calls to function has reached maxfev = 1000.
  out = leastsq(errfunc, init, args=(xdata[:fin], ydata[:fin]))
---------------------------------------------------------------------------
IndexError                                Traceback (most recent call last)
Cell In[36], line 18
     16 bg_lili.append(nima.bg(frame, kind="li_li")[0])
     17 bg_utils.append(utils.bg(frame)[0])
---> 18 bg2_utils.append(utils.bg2(frame)[0])

File ~/checkouts/readthedocs.org/user_builds/nima/envs/tut2/lib/python3.11/site-packages/nima/utils.py:165, in bg2(img, step, bgmax)
    163 density = density(x)
    164 # MAYBE: plot x, density
--> 165 pos_max = signal.find_peaks(density, width=2, rel_height=0.1)[0][0]
    166 v = density[pos_max] / 2
    167 pos_delta = signal.find_peaks(-np.absolute(density - v), width=2, rel_height=0.2)[
    168     0
    169 ][0]

IndexError: index 0 is out of bounds for axis 0 with size 0
[37]:
skimage.io.imshow(frame)
/home/docs/checkouts/readthedocs.org/user_builds/nima/envs/tut2/lib/python3.11/site-packages/skimage/io/_plugins/matplotlib_plugin.py:149: UserWarning: Low image data range; displaying image with stretched contrast.
  lo, hi, cmap = _get_display_range(image)
[37]:
<matplotlib.image.AxesImage at 0x7f5db4c6f5d0>
[38]:
# Create DataFrame to organize results and plot boxplot
df = pd.DataFrame(
    np.column_stack(
        #        (bg_arcsinh, bg_entropy, bg_adaptive, bg_liadaptive, bg_lili, bg_utils)
        (bg_arcsinh, bg_adaptive, bg_liadaptive, bg_lili, bg_utils, bg2_utils)
    ),
    columns=["arcsinh", "adaptive", "li_adaptive", "li li", "utils.bg", "utils.bg2"],
)
f = df.boxplot(vert=False, showfliers=False)
---------------------------------------------------------------------------
ValueError                                Traceback (most recent call last)
Cell In[38], line 3
      1 # Create DataFrame to organize results and plot boxplot
      2 df = pd.DataFrame(
----> 3     np.column_stack(
      4         #        (bg_arcsinh, bg_entropy, bg_adaptive, bg_liadaptive, bg_lili, bg_utils)
      5         (bg_arcsinh, bg_adaptive, bg_liadaptive, bg_lili, bg_utils, bg2_utils)
      6     ),
      7     columns=["arcsinh", "adaptive", "li_adaptive", "li li", "utils.bg", "utils.bg2"],
      8 )
      9 f = df.boxplot(vert=False, showfliers=False)

File ~/checkouts/readthedocs.org/user_builds/nima/envs/tut2/lib/python3.11/site-packages/numpy/lib/shape_base.py:652, in column_stack(tup)
    650         arr = array(arr, copy=False, subok=True, ndmin=2).T
    651     arrays.append(arr)
--> 652 return _nx.concatenate(arrays, 1)

ValueError: all the input array dimensions except for the concatenation axis must match exactly, but along dimension 0, the array at index 0 has size 23 and the array at index 5 has size 22
[39]:
import seaborn as sb

sb.regplot(pd.DataFrame(dict(x=bg_arcsinh, y=bg2_utils)), x="x", y="y")
---------------------------------------------------------------------------
ValueError                                Traceback (most recent call last)
Cell In[39], line 3
      1 import seaborn as sb
----> 3 sb.regplot(pd.DataFrame(dict(x=bg_arcsinh, y=bg2_utils)), x="x", y="y")

File ~/checkouts/readthedocs.org/user_builds/nima/envs/tut2/lib/python3.11/site-packages/pandas/core/frame.py:767, in DataFrame.__init__(self, data, index, columns, dtype, copy)
    761     mgr = self._init_mgr(
    762         data, axes={"index": index, "columns": columns}, dtype=dtype, copy=copy
    763     )
    765 elif isinstance(data, dict):
    766     # GH#38939 de facto copy defaults to False only in non-dict cases
--> 767     mgr = dict_to_mgr(data, index, columns, dtype=dtype, copy=copy, typ=manager)
    768 elif isinstance(data, ma.MaskedArray):
    769     from numpy.ma import mrecords

File ~/checkouts/readthedocs.org/user_builds/nima/envs/tut2/lib/python3.11/site-packages/pandas/core/internals/construction.py:503, in dict_to_mgr(data, index, columns, dtype, typ, copy)
    499     else:
    500         # dtype check to exclude e.g. range objects, scalars
    501         arrays = [x.copy() if hasattr(x, "dtype") else x for x in arrays]
--> 503 return arrays_to_mgr(arrays, columns, index, dtype=dtype, typ=typ, consolidate=copy)

File ~/checkouts/readthedocs.org/user_builds/nima/envs/tut2/lib/python3.11/site-packages/pandas/core/internals/construction.py:114, in arrays_to_mgr(arrays, columns, index, dtype, verify_integrity, typ, consolidate)
    111 if verify_integrity:
    112     # figure out the index, if necessary
    113     if index is None:
--> 114         index = _extract_index(arrays)
    115     else:
    116         index = ensure_index(index)

File ~/checkouts/readthedocs.org/user_builds/nima/envs/tut2/lib/python3.11/site-packages/pandas/core/internals/construction.py:677, in _extract_index(data)
    675 lengths = list(set(raw_lengths))
    676 if len(lengths) > 1:
--> 677     raise ValueError("All arrays must be of the same length")
    679 if have_dicts:
    680     raise ValueError(
    681         "Mixing dicts with non-Series may lead to ambiguous ordering."
    682     )

ValueError: All arrays must be of the same length
[40]:
np.argmax(bg_arcsinh)
[40]:
12
[41]:
bg2_utils.pop(14)
[41]:
9.6
[42]:
def gen_object(
    nrows: int = 128, ncols: int = 128, min_radius: int = 6, max_radius: int = 12
):
    """Generate a single small object without random positioning."""
    x_idx, y_idx = np.indices((nrows, ncols))
    x_obj = nrows // 2  # Center of the frame
    y_obj = ncols // 2  # Center of the frame
    radius = np.random.randint(min_radius, max_radius)
    ellipsis = np.random.rand() * 3.5 - 1.75
    mask = np.array(
        (x_idx - x_obj) ** 2
        + (y_idx - y_obj) ** 2
        + ellipsis * (x_idx - x_obj) * (y_idx - y_obj)
        < radius**2
    )
    return mask


# Generate a single small object
small_object = gen_object(nrows=12, ncols=12, min_radius=3, max_radius=4)

# Plot the generated object
plt.imshow(small_object, cmap="gray")
plt.title("Single Small Object")
plt.xlabel("X")
plt.ylabel("Y")
plt.show()
[43]:
import scipy.signal

# Convolve the small object with the flat image
convolved_image = scipy.signal.convolve2d(flat, small_object, mode="same")

# Plot the convolved image
plt.imshow(convolved_image, cmap="gray")
plt.colorbar()
plt.title("Convolved Image")
---------------------------------------------------------------------------
NameError                                 Traceback (most recent call last)
Cell In[43], line 4
      1 import scipy.signal
      3 # Convolve the small object with the flat image
----> 4 convolved_image = scipy.signal.convolve2d(flat, small_object, mode="same")
      6 # Plot the convolved image
      7 plt.imshow(convolved_image, cmap="gray")

NameError: name 'flat' is not defined
[44]:
flat.shape[1] - small_object.shape[1]
---------------------------------------------------------------------------
NameError                                 Traceback (most recent call last)
Cell In[44], line 1
----> 1 flat.shape[1] - small_object.shape[1]

NameError: name 'flat' is not defined
[45]:
# Number of frames in the stack
num_frames = 10000

# Initialize an empty stack to store the frames
stack = np.zeros_like(flat)

# Iterate over each frame in the stack
for _ in range(num_frames):
    # Generate random coordinates for the position of the small object within the flat image
    x_pos = np.random.randint(0, flat.shape[1] - small_object.shape[1])
    y_pos = np.random.randint(0, flat.shape[0] - small_object.shape[0])

    # Add the small object to the flat image at the random position
    flat_image_with_object = flat.copy()
    flat_image_with_object[
        y_pos : y_pos + small_object.shape[0], x_pos : x_pos + small_object.shape[1]
    ] += small_object

    # Add the frame with the small object to the stack
    stack += flat_image_with_object

# Plot the summed stack
estimated = stack / stack.mean()
plt.imshow(estimated, cmap="gray")
plt.colorbar()
plt.title("Summed Stack with Small Object")
plt.show()
# plt.imshow(estimated - flat, cmap='gray')
skimage.io.imshow(ndimage.gaussian_filter(estimated, sigma=3) - flat)
---------------------------------------------------------------------------
NameError                                 Traceback (most recent call last)
Cell In[45], line 5
      2 num_frames = 10000
      4 # Initialize an empty stack to store the frames
----> 5 stack = np.zeros_like(flat)
      7 # Iterate over each frame in the stack
      8 for _ in range(num_frames):
      9     # Generate random coordinates for the position of the small object within the flat image

NameError: name 'flat' is not defined
[46]:
# Calculate the Fourier transform of the small object
fourier_transform_obj = np.fft.fft2(small_object)

# Calculate the magnitude spectrum of the Fourier transform
magnitude_spectrum = np.abs(np.fft.fftshift(fourier_transform_obj))

# Plot the magnitude spectrum
plt.imshow(magnitude_spectrum, cmap="gray")
plt.colorbar(label="Magnitude")
plt.title("Magnitude Spectrum of Fourier Transform")
plt.xlabel("Frequency (kx)")
plt.ylabel("Frequency (ky)")
plt.show()
[47]:
# Apply the convolution theorem
flat_fft = np.fft.fft2(stack)

# Calculate the Fourier transform of the small object
fourier_transform_obj = np.fft.fft2(small_object)

# Pad the small object to match the shape of flat
padded_obj = np.pad(
    small_object,
    (
        (0, flat.shape[0] - small_object.shape[0]),
        (0, flat.shape[1] - small_object.shape[1]),
    ),
    mode="constant",
)

# Calculate the Fourier transform of the padded small object
fourier_transform_padded_obj = np.fft.fft2(padded_obj)

# Calculate the Fourier transform of the flat image
flat_fft = np.fft.fft2(flat)

# Perform element-wise division
result_fft = np.fft.ifftshift(
    np.fft.ifft2(np.fft.fftshift(flat_fft / fourier_transform_padded_obj))
)
# result_fft = np.fft.ifftshift(np.fft.ifft2(np.fft.fftshift(flat_fft / fourier_transform_obj)))

# Take the real part to get rid of any numerical artifacts
result = np.real(result_fft)

# Plot the resulting flat image
plt.imshow(result, cmap="gray")
plt.colorbar(label="Intensity")
plt.title("Resulting Flat Image")
plt.xlabel("X")
plt.ylabel("Y")
plt.show()
---------------------------------------------------------------------------
NameError                                 Traceback (most recent call last)
Cell In[47], line 2
      1 # Apply the convolution theorem
----> 2 flat_fft = np.fft.fft2(stack)
      4 # Calculate the Fourier transform of the small object
      5 fourier_transform_obj = np.fft.fft2(small_object)

NameError: name 'stack' is not defined
[48]:
from nima import generat

flat = generat.gen_flat()
bias = np.zeros((128, 128))

objs = generat.gen_objs(max_fluor=20, max_n_obj=80)
frame = generat.gen_frame(objs, bias=bias, flat=flat, noise_sd=2, dark=7, sky=7)

# Plot the frame
plt.imshow(frame, cmap="viridis", origin="lower")
plt.colorbar(label="Intensity")
plt.title("Simulated Image Frame without Bias")
plt.xlabel("X")
plt.ylabel("Y")
plt.show()
[49]:
from tqdm import tqdm

# Generate a stack of frames
num_frames = 100
frame_stack = []
for _ in tqdm(range(num_frames), desc="Generating Frames"):
    objs = generat.gen_objs(max_fluor=20, max_n_obj=80)
    frame = generat.gen_frame(objs, bias=bias, flat=flat, noise_sd=2, dark=7, sky=7)
    frame_stack.append(frame)
- Generating Frames: 0%| | 0/100 [00:00<?, ?it/s]
</pre>
- Generating Frames: 0%| | 0/100 [00:00<?, ?it/s]
end{sphinxVerbatim}
Generating Frames: 0%| | 0/100 [00:00<?, ?it/s]
- Generating Frames: 10%|█ | 10/100 [00:00<00:01, 89.20it/s]
</pre>
- Generating Frames: 10%|█ | 10/100 [00:00<00:01, 89.20it/s]
end{sphinxVerbatim}
Generating Frames: 10%|█ | 10/100 [00:00<00:01, 89.20it/s]
- Generating Frames: 21%|██ | 21/100 [00:00<00:00, 98.83it/s]
</pre>
- Generating Frames: 21%|██ | 21/100 [00:00<00:00, 98.83it/s]
end{sphinxVerbatim}
Generating Frames: 21%|██ | 21/100 [00:00<00:00, 98.83it/s]
- Generating Frames: 32%|███▏ | 32/100 [00:00<00:00, 100.15it/s]
</pre>
- Generating Frames: 32%|███▏ | 32/100 [00:00<00:00, 100.15it/s]
end{sphinxVerbatim}
Generating Frames: 32%|███▏ | 32/100 [00:00<00:00, 100.15it/s]
- Generating Frames: 43%|████▎ | 43/100 [00:00<00:00, 94.33it/s]
</pre>
- Generating Frames: 43%|████▎ | 43/100 [00:00<00:00, 94.33it/s]
end{sphinxVerbatim}
Generating Frames: 43%|████▎ | 43/100 [00:00<00:00, 94.33it/s]
- Generating Frames: 53%|█████▎ | 53/100 [00:00<00:00, 90.51it/s]
</pre>
- Generating Frames: 53%|█████▎ | 53/100 [00:00<00:00, 90.51it/s]
end{sphinxVerbatim}
Generating Frames: 53%|█████▎ | 53/100 [00:00<00:00, 90.51it/s]
- Generating Frames: 63%|██████▎ | 63/100 [00:00<00:00, 88.74it/s]
</pre>
- Generating Frames: 63%|██████▎ | 63/100 [00:00<00:00, 88.74it/s]
end{sphinxVerbatim}
Generating Frames: 63%|██████▎ | 63/100 [00:00<00:00, 88.74it/s]
- Generating Frames: 73%|███████▎ | 73/100 [00:00<00:00, 90.58it/s]
</pre>
- Generating Frames: 73%|███████▎ | 73/100 [00:00<00:00, 90.58it/s]
end{sphinxVerbatim}
Generating Frames: 73%|███████▎ | 73/100 [00:00<00:00, 90.58it/s]
- Generating Frames: 83%|████████▎ | 83/100 [00:00<00:00, 86.66it/s]
</pre>
- Generating Frames: 83%|████████▎ | 83/100 [00:00<00:00, 86.66it/s]
end{sphinxVerbatim}
Generating Frames: 83%|████████▎ | 83/100 [00:00<00:00, 86.66it/s]
- Generating Frames: 92%|█████████▏| 92/100 [00:01<00:00, 85.68it/s]
</pre>
- Generating Frames: 92%|█████████▏| 92/100 [00:01<00:00, 85.68it/s]
end{sphinxVerbatim}
Generating Frames: 92%|█████████▏| 92/100 [00:01<00:00, 85.68it/s]
- Generating Frames: 100%|██████████| 100/100 [00:01<00:00, 90.31it/s]
</pre>
- Generating Frames: 100%|██████████| 100/100 [00:01<00:00, 90.31it/s]
end{sphinxVerbatim}
Generating Frames: 100%|██████████| 100/100 [00:01<00:00, 90.31it/s]
[50]:
from functools import partial

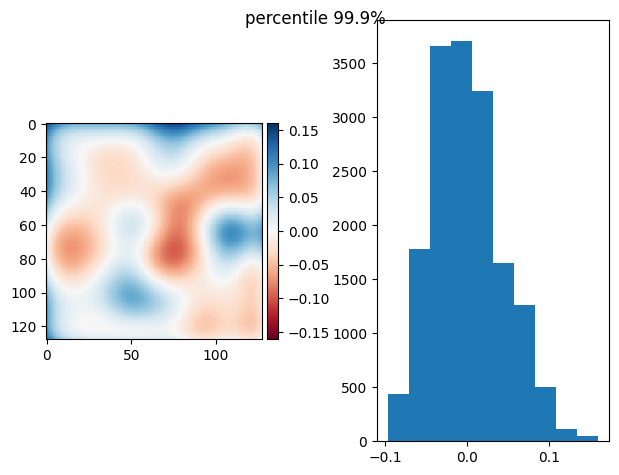
p999 = partial(np.percentile, q=99.7)
p999.__name__ = "percentile 99.9%"


def diff_plot(im, flat, title):
    f, axs = plt.subplots(1, 2)
    diff = im / im.mean() - flat
    skimage.io.imshow(diff, ax=axs[0])
    axs[1].hist(diff.ravel())
    f.suptitle(title)
    return diff.mean(), diff.std()


def prj_plot(t_prj, title, sigma=128 / 11):
    im = ndimage.gaussian_filter(t_prj, sigma=sigma)
    return diff_plot(im, flat, title)


def prj(stack, func, sigma):
    t_prj = func(stack, axis=0)
    return prj_plot(t_prj, func.__name__)


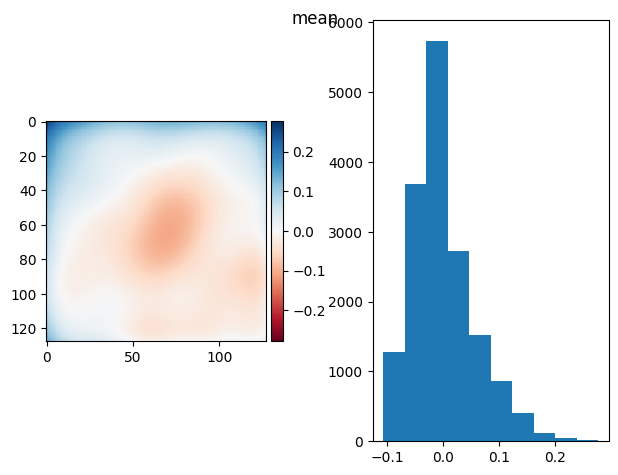
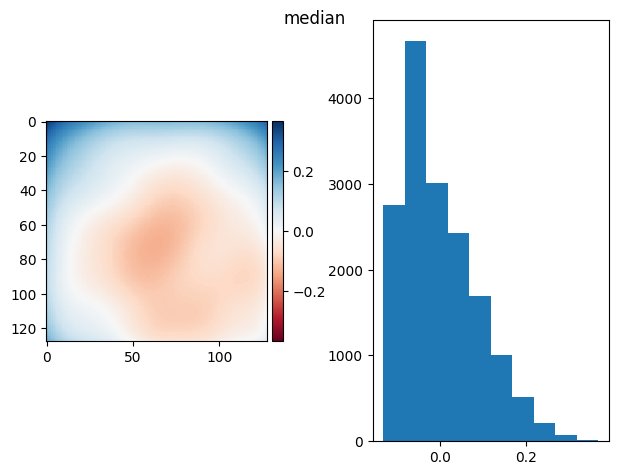
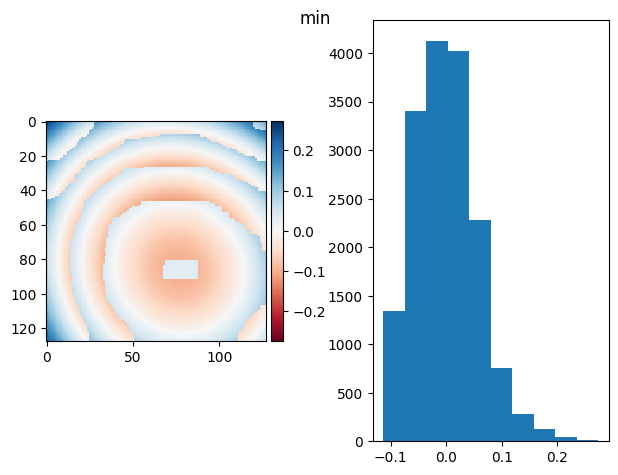
prj(frame_stack, np.max, sigma=3)
prj(frame_stack, p999, sigma=3)
prj(frame_stack, np.mean, sigma=3)
prj(frame_stack, np.median, sigma=3)
prj(frame_stack, np.min, sigma=3)
[50]:
(2.5153490401663703e-17, 0.05573358872892436)
[51]:
objs = generat.gen_objs(max_fluor=20, max_n_obj=8)
frame = generat.gen_frame(objs, bias=bias, flat)
plt.imshow(frame)
  Cell In[51], line 2
    frame = generat.gen_frame(objs, bias=bias, flat)
                                                   ^
SyntaxError: positional argument follows keyword argument
[52]:
bias = np.zeros((128, 128))
flat = np.ones((128, 128))

stack = np.stack(
    [
        generat.gen_frame(
            generat.gen_objs(max_fluor=10), bias, flat, noise_sd=10, sky=10
        )
        for i in range(1000)
    ]
)
[53]:
stat_bg = []
for s in stack[:]:
    stat_bg.append(utils.bg(s)[0])
[54]:
plt.hist(stat_bg)
np.mean(stat_bg), np.std(stat_bg)
[54]:
(8.999814157903783, 0.32113486008503295)
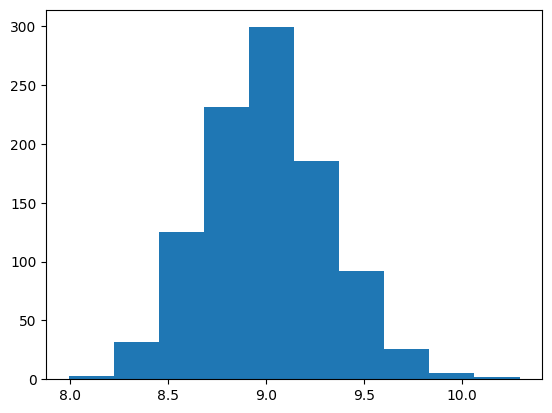
bg2 was less robust with small signal
3.2.2. what is the best projection for flat calculation?#
[55]:
bias = generat.gen_bias()
flat = generat.gen_flat()
stack = np.stack(
    [
        generat.gen_frame(generat.gen_objs(max_fluor=20), bias, flat, noise_sd=1, sky=2)
        for i in range(1000)
    ]
)
[56]:
def splot(stack, num=4):
    f, axs = plt.subplots(1, num)
    for i in range(num):
        axs[i].imshow(stack[np.random.randint(len(stack))])


splot(stack)
[57]:
def diff_plot(im, flat, title):
    f, axs = plt.subplots(1, 2)
    diff = im / im.mean() - flat
    skimage.io.imshow(diff, ax=axs[0])
    axs[1].hist(diff.ravel())
    f.suptitle(title)
    return diff.mean(), diff.std()


def prj_plot(t_prj, title, sigma=128 / 11):
    im = ndimage.gaussian_filter(t_prj, sigma=sigma)
    return diff_plot(im, flat, title)


def prj(stack, func):
    t_prj = func(stack, axis=0)
    return prj_plot(t_prj, func.__name__)


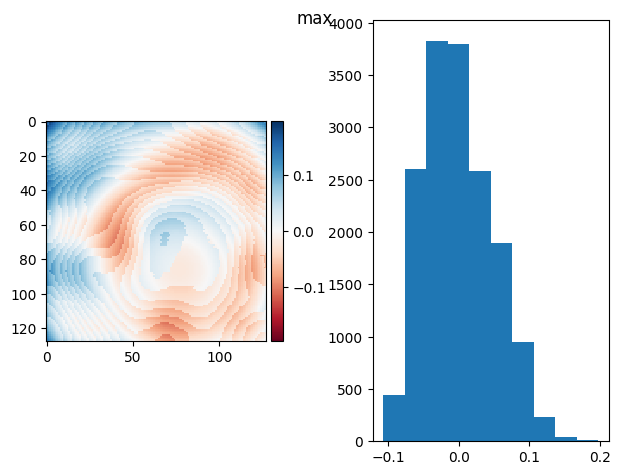
prj(stack, np.max)
[57]:
(6.938893903907228e-17, 0.04784576164378098)
[58]:
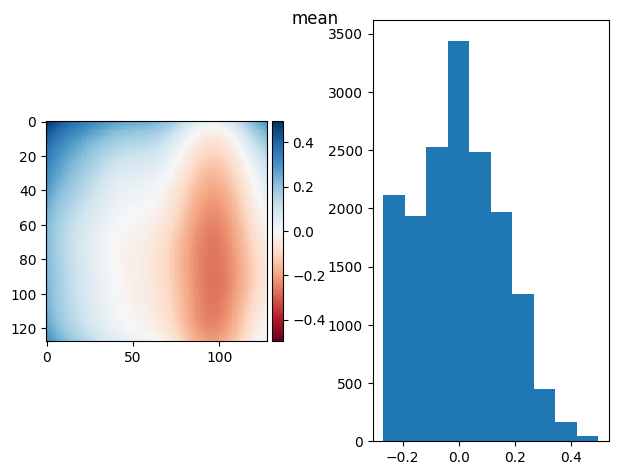
prj(stack, np.mean)
[58]:
(1.3877787807814457e-17, 0.15126102674542985)
[59]:
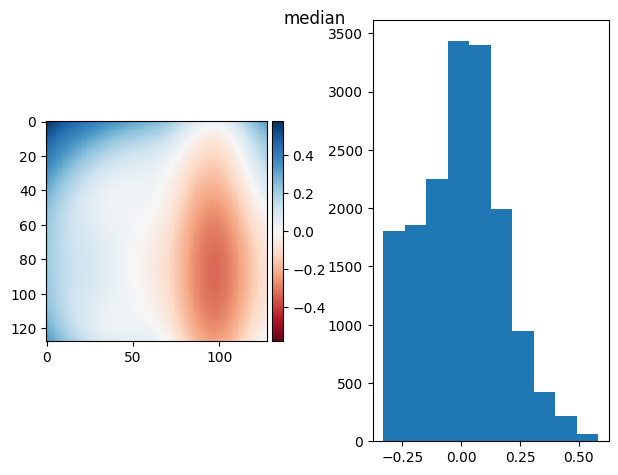
prj(stack, np.median)
[59]:
(-5.551115123125783e-17, 0.1742986558323235)
[60]:
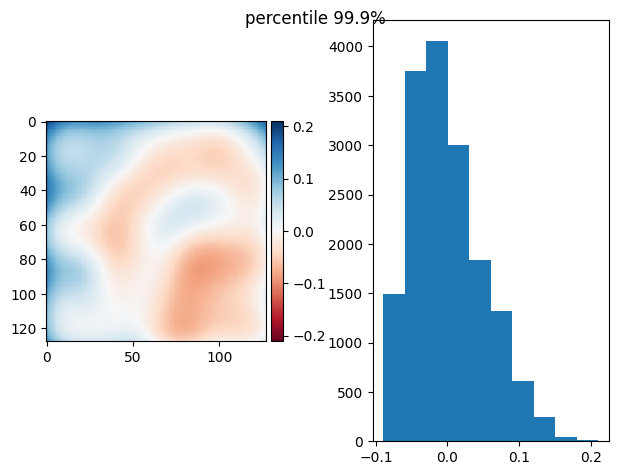
from functools import partial

p999 = partial(np.percentile, q=99.9)
p999.__name__ = "percentile 99.9%"

prj(stack, p999)
[60]:
(1.0408340855860843e-16, 0.049948831393755326)
[61]:
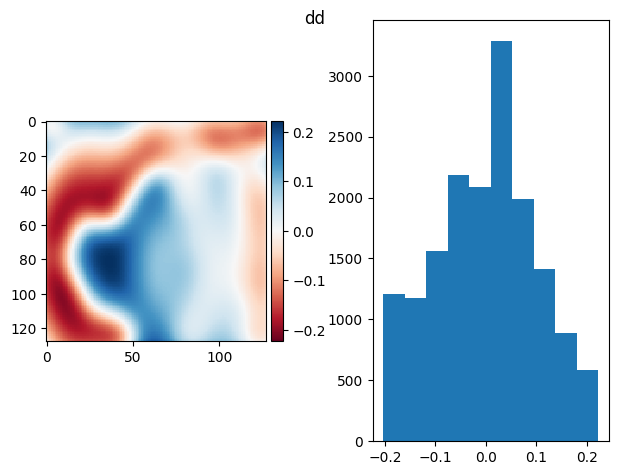
im = np.mean(
    ndfilters.median_filter(
        da.from_array(stack[:100] - bias), size=(32, 16, 16)
    ).compute(),
    axis=0,
)
prj_plot(im, "dd", sigma=7)
[61]:
(1.1449174941446927e-16, 0.10002479860488382)
[ ]:
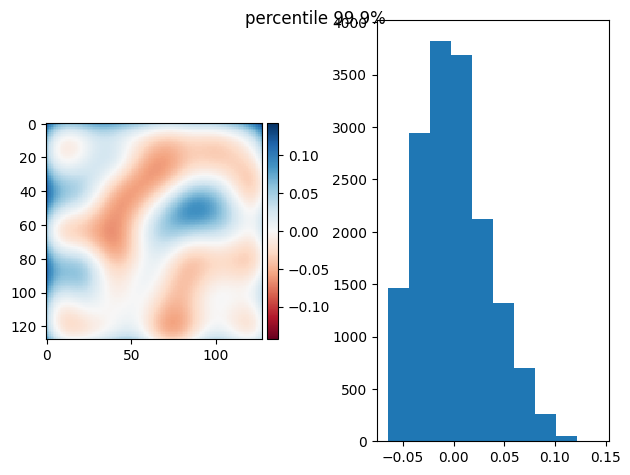
3.2.2.1. Knowing the Bias.#
[62]:
prj(stack - bias, p999)
[62]:
(7.155734338404329e-17, 0.03445546194190759)
[63]:
prj(stack - bias, np.mean)
[63]:
(9.367506770274758e-17, 0.03297218177443997)
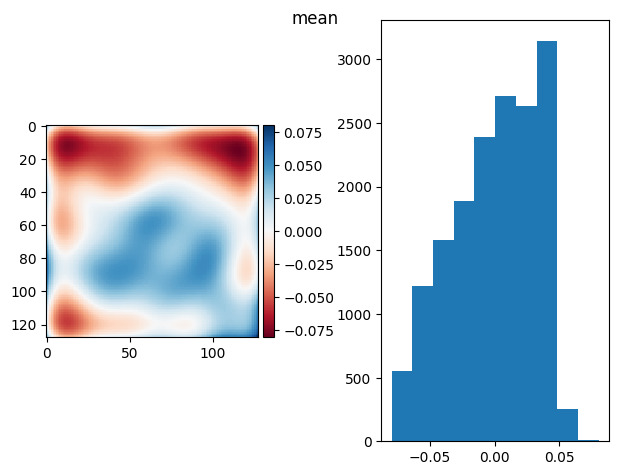
3.3. Using fg and bg masks?#
And assuming we know the bias of the camera.
[64]:
def mask_plane(plane, bg_ave=2, bg_std=1.19, erf_pvalue=0.01):
    p = utils.prob(plane, bg_ave, bg_std)
    p = ndimage.median_filter(p, size=2)
    mask = p > erf_pvalue
    mask = skimage.morphology.remove_small_holes(mask)
    return np.ma.masked_array(plane, mask=~mask), np.ma.masked_array(plane, mask=mask)


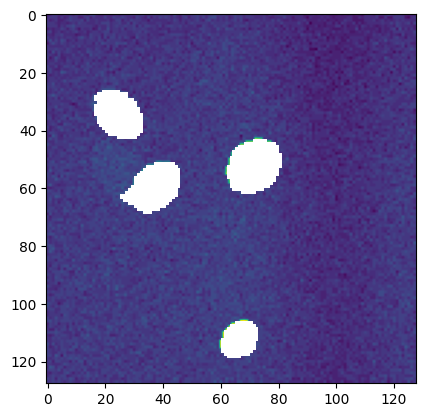
plt.imshow(mask_plane(stack[113], *utils.bg(stack[113]))[0])
[64]:
<matplotlib.image.AxesImage at 0x7f5db6879810>
[65]:
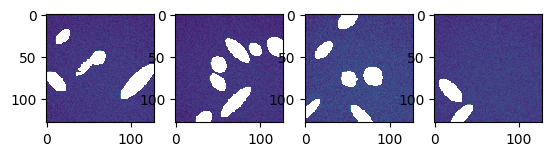
bgs, fgs = list(zip(*[mask_plane(s - bias, *utils.bg(s - bias)) for s in stack]))

splot(bgs)
[66]:
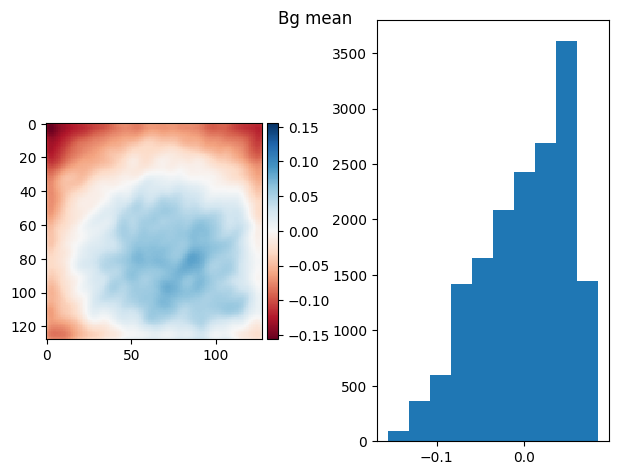
t_prj = np.ma.mean(np.ma.stack(bgs), axis=0)
prj_plot(t_prj, "Bg mean", sigma=3)
[66]:
(9.8879238130678e-17, 0.050434052258550494)
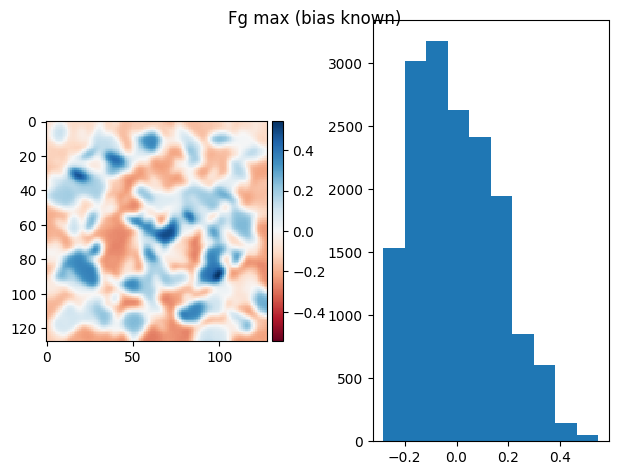
[67]:
t_prj = np.ma.max(np.ma.stack(fgs), axis=0)
prj_plot(t_prj, "Fg max (bias known)", sigma=2)
[67]:
(6.071532165918825e-18, 0.15967687276836431)
[68]:
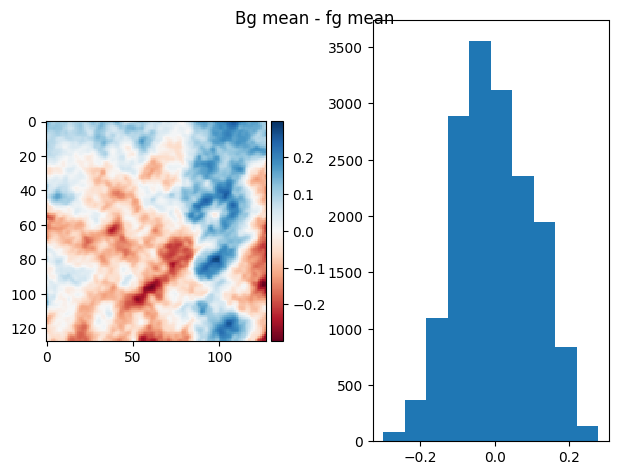
bgs, fgs = list(zip(*[mask_plane(s, *utils.bg(s)) for s in stack]))

bg_prj1 = np.ma.mean(np.ma.stack(bgs[:]), axis=0)
fg_prj1 = np.ma.mean(np.ma.stack(fgs[:]), axis=0)
im = fg_prj1 - bg_prj1
diff_plot(ndimage.gaussian_filter(im, 1), flat, "Bg mean - fg mean")
[68]:
(2.0816681711721685e-16, 0.10077702511108609)
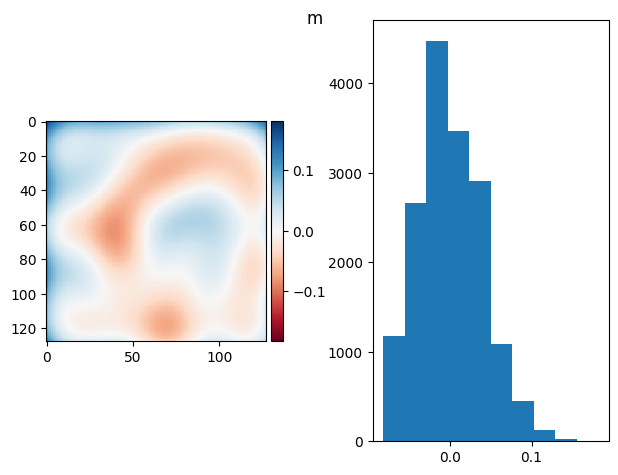
[69]:
bg_prj = np.ma.mean(bgs, axis=0)
fg_prj = np.ma.max(fgs, axis=0)
# im = ndimage.median_filter(bg_prj-fg_prj, size=60) #- 2 * flat
im = ndimage.gaussian_filter(bg_prj - fg_prj, sigma=14)  # - 2 * flat

diff_plot(im, flat, "m")
[69]:
(6.548581121812447e-17, 0.03919753374909028)
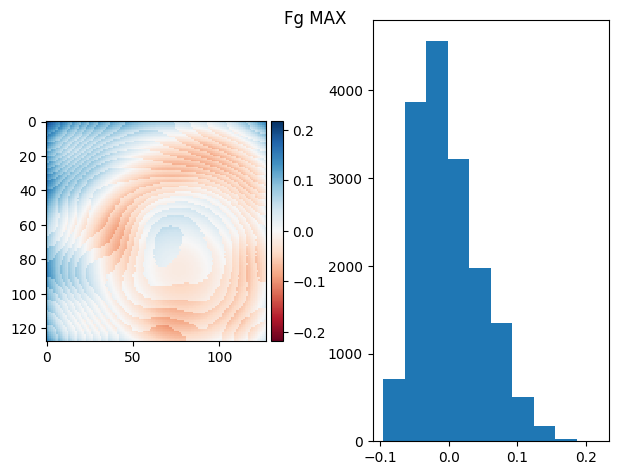
[70]:
t_prj = np.ma.max(fgs, axis=0)
prj_plot(t_prj, "Fg MAX", sigma=13)
[70]:
(7.45931094670027e-17, 0.047306148289888536)
[71]:
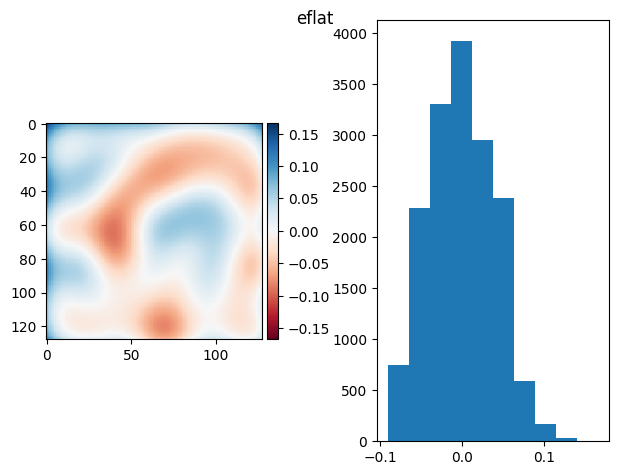
eflat = bg_prj - fg_prj
eflat /= eflat.mean()
eflat = ndimage.gaussian_filter(eflat, sigma=13)

diff_plot(eflat, flat, "eflat")
[71]:
(1.448494102440634e-16, 0.04005668358604731)
3.3.1. When bias and flat are unknown…#
bias = bg_prj - sky * flat
bias = fg_prj - flat
sky * flat - flat = bg_prj - fg_prj
[72]:
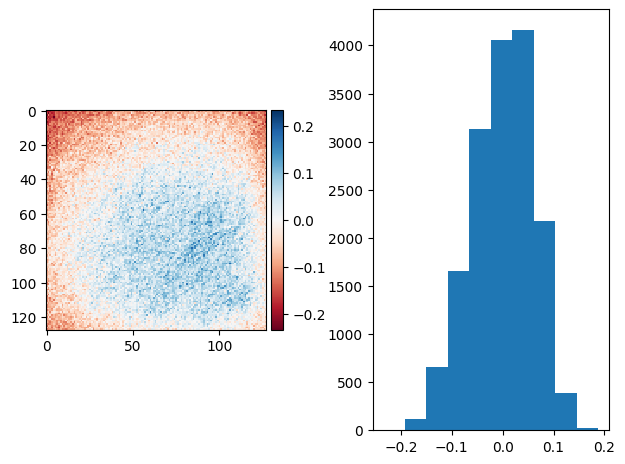
diff_plot((bg_prj1 - bias) / 2, flat, "")
/home/docs/checkouts/readthedocs.org/user_builds/nima/envs/tut2/lib/python3.11/site-packages/numpy/lib/function_base.py:4824: UserWarning: Warning: 'partition' will ignore the 'mask' of the MaskedArray.
  arr.partition(
[72]:
(5.204170427930421e-17, 0.06004439726548906)
[73]:
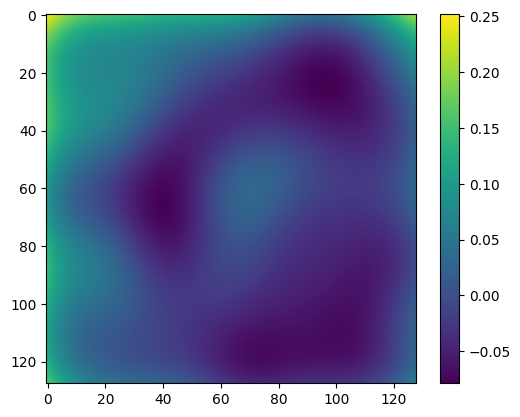
plt.imshow((im - bias) / (im - bias).mean() - flat)
plt.colorbar()
[73]:
<matplotlib.colorbar.Colorbar at 0x7f5db582f290>
3.3.2. cfr. nima.bg#
[74]:
# r = nima.bg((stack[113] - bias) / flat)
r = nima.bg(stack[111])
[75]:
r[1].mean(), r[1].std()
[75]:
(3.350785340314136, 1.0560158807085496)
[76]:
utils.bg(stack[111])
[76]:
(5.090341250496636, 0.6077382147067922)
[77]:
bias.mean() + 2
[77]:
5.418070740426731
3.3.3. geometric mean#
[78]:
vals = [0.8, 0.1, 0.3, 0.1, 0.8, 0.8, 0.8, 0.1, 0.8]

np.median(vals), scipy.stats.gmean(vals), np.mean(vals)
[78]:
(0.8, 0.35869897213131746, 0.5111111111111111)
[79]:
(0.8 * 0.8 * 0.8 * 0.8 * 0.1) ** (1 / 5)
[79]:
0.5278031643091577