4. dev with dask#
[1]:
from collections import defaultdict
import dask.array as da
import holoviews as hv
import hvplot
import matplotlib.pyplot as plt
import numpy as np
import pandas as pd
import skimage
import tifffile as tff
from scipy import ndimage
from nima import nima, utils
%load_ext autoreload
%autoreload 2
fp = "../../tests/data/1b_c16_15.tif"
[2]:
daimg = da.from_zarr(tff.imread(fp, aszarr=True))
daimg
[2]:
|
||||||||||||||||
[3]:
utils.bg(daimg[0, 0].compute())
[3]:
(np.float64(457.83810271602636), np.float64(48.50287781525401))
[4]:
def dabg(daimg):
r = defaultdict(list)
n_t, n_c = daimg.shape[:2]
for t in range(n_t):
for c in range(n_c):
r[c].append(utils.bg(daimg[t, c].compute())[0])
return pd.DataFrame(r)
dabg(daimg)
[4]:
| 0 | 1 | 2 | |
|---|---|---|---|
| 0 | 457.838103 | 257.010232 | 289.378226 |
| 1 | 457.295253 | 259.072942 | 289.627120 |
| 2 | 457.760178 | 260.182073 | 290.268666 |
| 3 | 453.995201 | 257.189940 | 285.613583 |
[5]:
def dabg_fg(daimg, erf_pvalue=1e-100, size=10):
n_t, n_c = daimg.shape[:2]
bgs = defaultdict(list)
fgs = defaultdict(list)
for t in range(n_t):
p = np.ones(daimg.shape[-2:])
multichannel = daimg[t].compute()
for c in range(n_c):
av, sd = utils.bg(multichannel[c])
p = p * utils.prob(multichannel[c], av, sd)
bgs[c].append(av)
mask = ndimage.median_filter((p) ** (1 / n_c), size=size) < erf_pvalue
for c in range(n_c):
fgs[c].append(np.ma.mean(np.ma.masked_array(multichannel[c], mask=~mask)))
return pd.DataFrame(bgs), pd.DataFrame(fgs)
dfb, dff = dabg_fg(daimg)
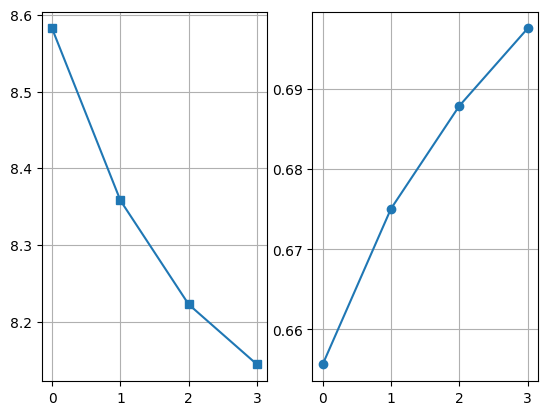
[6]:
plt.subplot(121)
((dff - dfb)[0] / (dff - dfb)[2]).plot(marker="s")
plt.grid()
plt.subplot(122)
((dff - dfb)[2] / (dff - dfb)[1]).plot(marker="o")
plt.grid()
NEXT:
make utils.bg and utils.prob work with dask arrays
[7]:
def dmask(daim, erf_pvalue=1e-100, size=10):
n_c = daim.shape[0]
im = daim[0].compute()
p = utils.prob(im, *utils.bg(im))
for c in range(1, n_c):
im = daim[c].compute()
p = p * utils.prob(im, *utils.bg(im))
p = ndimage.median_filter((p) ** (1 / n_c), size=size)
mask = p < erf_pvalue
return skimage.morphology.remove_small_objects(mask)
# mask = skimage.morphology.remove_small_holes(mask)
# return np.ma.masked_array(plane, mask=~mask), np.ma.masked_array(plane, mask=mask)
mask = dmask(daimg[2])
lab, nlab = ndimage.label(mask)
lab, nlab
[7]:
(array([[0, 0, 0, ..., 0, 0, 0],
[0, 0, 0, ..., 0, 0, 0],
[0, 0, 0, ..., 0, 0, 0],
...,
[0, 0, 0, ..., 0, 0, 0],
[0, 0, 0, ..., 0, 0, 0],
[0, 0, 0, ..., 0, 0, 0]], shape=(512, 512), dtype=int32),
2)
[8]:
pr = skimage.measure.regionprops(lab, intensity_image=daimg[0][0])
pr[1].equivalent_diameter
/tmp/ipykernel_2866/2414770940.py:2: FutureWarning: `RegionProperties.equivalent_diameter` is deprecated starting in version 0.26 and will be removed in version 2.0. Use `RegionProperties.equivalent_diameter_area` instead.
pr[1].equivalent_diameter
[8]:
np.float64(195.49311541527658)
[9]:
max_diameter = pr[0].equivalent_diameter
size = int(max_diameter * 0.3)
size
/tmp/ipykernel_2866/3781991249.py:1: FutureWarning: `RegionProperties.equivalent_diameter` is deprecated starting in version 0.26 and will be removed in version 2.0. Use `RegionProperties.equivalent_diameter_area` instead.
max_diameter = pr[0].equivalent_diameter
[9]:
47
[10]:
t = 0
mask = dmask(daimg[t])
# skimage.io.imshow(mask)
lab, nlab = ndimage.label(mask)
distance = ndimage.distance_transform_edt(mask)
# distance = skimage.filters.gaussian(distance, sigma=0) min_distance=size,
coords = skimage.feature.peak_local_max(
distance, footprint=np.ones((size, size)), labels=lab
)
mm = np.zeros(distance.shape, dtype=bool)
mm[tuple(coords.T)] = True
# markers, _ = ndimage.label(mm)
markers = skimage.measure.label(mm)
labels = skimage.segmentation.watershed(-distance, markers, mask=mask)
_, (ax0, ax1, ax2) = plt.subplots(1, 3)
ax0.imshow(distance)
ax1.imshow(labels)
ax2.imshow(labels == 3)
coords
[10]:
array([[122, 329],
[122, 510],
[475, 125],
[341, 116],
[421, 1]])

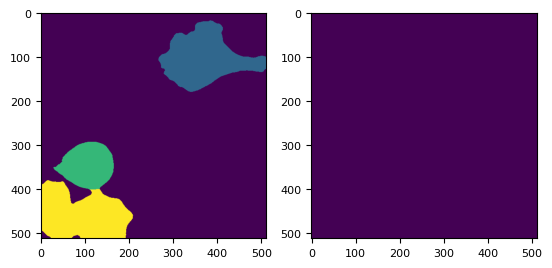
[11]:
masks = [dmask(daimg[t]) for t in range(4)]
[12]:
masks = np.stack(masks)
masks.shape
[12]:
(4, 512, 512)
[13]:
tff.imshow(masks)
[13]:
(<Figure size 988.8x604.8 with 3 Axes>,
<Axes: >,
<matplotlib.image.AxesImage at 0x7a971c51afd0>)

[14]:
distance = ndimage.distance_transform_edt(masks)
distance = skimage.filters.gaussian(distance, sigma=5)
[15]:
import impy
impy.array(distance).imshow()

[15]:
| name | No name |
| shape | 4(t), 512(y), 512(x) |
| label shape | No label |
| dtype | float64 |
| source | None |
| scale | ScaleView(t=1.0000, y=1.0000, x=1.0000) |
[16]:
for t in range(4):
coords = skimage.feature.peak_local_max(distance[t], footprint=np.ones((130, 130)))
print(coords)
[[114 346]
[473 128]
[344 110]]
[[114 346]
[473 128]
[344 110]]
[[114 346]
[473 128]
[344 110]]
[[114 346]
[473 128]
[344 110]]
[17]:
co = np.stack([coords, coords, coords, coords])
[18]:
coords.T
[18]:
array([[114, 473, 344],
[346, 128, 110]])
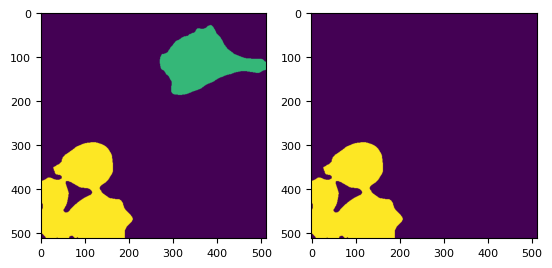
[19]:
mm = np.zeros(masks[0].shape, dtype=bool)
mm[tuple(co.T)] = True
# markers, _ = ndimage.label(mm)
markers = skimage.measure.label(np.stack([mm, mm, mm, mm]))
labels = skimage.segmentation.watershed(-distance, markers, mask=masks)
_, (ax1, ax2) = plt.subplots(1, 2)
ax1.imshow(labels[3])
ax2.imshow(labels[3] == 4)
[19]:
<matplotlib.image.AxesImage at 0x7a971779c7d0>
[20]:
img = tff.imread(fp)
[21]:
dim, _, _ = nima.read_tiff(fp, channels=["R", "G", "C"])
(4, 512, 512)
[22]:
res = nima.d_bg(dim)
bgs = res[1]
---------------------------------------------------------------------------
TypeError Traceback (most recent call last)
Cell In[22], line 1
----> 1 res = nima.d_bg(dim)
2 bgs = res[1]
TypeError: d_bg() missing 1 required positional argument: 'bg_params'
[23]:
def ratio(t, roi):
g = img[t, 0][labels[t] == roi].mean() - bgs["G"][t]
r = img[t, 1][labels[t] == roi].mean() - bgs["R"][t]
c = img[t, 2][labels[t] == roi].mean() - bgs["C"][t]
return g / c, c / r
ratio(1, 4)
/tmp/ipykernel_2866/533071019.py:2: RuntimeWarning: Mean of empty slice
g = img[t, 0][labels[t] == roi].mean() - bgs["G"][t]
/home/docs/checkouts/readthedocs.org/user_builds/nima/envs/latest/lib/python3.13/site-packages/numpy/_core/_methods.py:142: RuntimeWarning: invalid value encountered in scalar divide
ret = ret.dtype.type(ret / rcount)
---------------------------------------------------------------------------
NameError Traceback (most recent call last)
Cell In[23], line 8
4 c = img[t, 2][labels[t] == roi].mean() - bgs["C"][t]
5 return g / c, c / r
----> 8 ratio(1, 4)
Cell In[23], line 2, in ratio(t, roi)
1 def ratio(t, roi):
----> 2 g = img[t, 0][labels[t] == roi].mean() - bgs["G"][t]
3 r = img[t, 1][labels[t] == roi].mean() - bgs["R"][t]
4 c = img[t, 2][labels[t] == roi].mean() - bgs["C"][t]
NameError: name 'bgs' is not defined
[24]:
rph = defaultdict(list)
rcl = defaultdict(list)
for roi in range(1, 5):
for t in range(4):
ph, cl = ratio(t, roi)
rph[roi].append(ph)
rcl[roi].append(cl)
plt.plot(rph[1])
plt.plot(rph[2])
plt.plot(rph[3])
plt.plot(rph[4])
---------------------------------------------------------------------------
NameError Traceback (most recent call last)
Cell In[24], line 5
3 for roi in range(1, 5):
4 for t in range(4):
----> 5 ph, cl = ratio(t, roi)
6 rph[roi].append(ph)
7 rcl[roi].append(cl)
Cell In[23], line 2, in ratio(t, roi)
1 def ratio(t, roi):
----> 2 g = img[t, 0][labels[t] == roi].mean() - bgs["G"][t]
3 r = img[t, 1][labels[t] == roi].mean() - bgs["R"][t]
4 c = img[t, 2][labels[t] == roi].mean() - bgs["C"][t]
NameError: name 'bgs' is not defined
[25]:
plt.plot(rcl[1])
plt.plot(rcl[2])
plt.plot(rcl[3])
plt.plot(rcl[4])
[25]:
[<matplotlib.lines.Line2D at 0x7a971c254cd0>]
[26]:
t = 2
mask = dmask(daimg[t])
# skimage.io.imshow(mask)
lab, nlab = ndimage.label(mask)
lab[~mask] = -1
# lab[lab==1] = -1
labels_ws = skimage.segmentation.random_walker(
daimg[t, 1].compute(), lab, beta=1e10, mode="bf"
)
# labels_ws = skimage.segmentation.random_walker(-distance, lab, beta=10000, mode="bf")
_, (ax1, ax2) = plt.subplots(1, 2)
ax1.imshow(labels_ws)
ax2.imshow(labels_ws == 2)
/home/docs/checkouts/readthedocs.org/user_builds/nima/envs/latest/lib/python3.13/site-packages/skimage/segmentation/random_walker_segmentation.py:545: UserWarning: Random walker only segments unlabeled areas, where labels == 0. No zero valued areas in labels were found. Returning provided labels.
(labels, nlabels, mask, inds_isolated_seeds, isolated_values) = _preprocess(labels)
[26]:
<matplotlib.image.AxesImage at 0x7a9714fd4410>
[27]:
imar = impy.imread(fp)
imar.label_threshold()
[27]:
| name | 1b_c16_15.tif |
| shape | 4(t), 3(c), 512(y), 512(x) |
| dtype | uint16 |
| source | ../../tests/data/1b_c16_15.tif |
| scale | ScaleView(t=1.0000, c=1.0000, y=0.2000, x=0.2000) |
[28]:
imar[:, 2].imshow(label=1)

[28]:
| name | 1b_c16_15.tif |
| shape | 4(t), 512(y), 512(x) |
| label shape | 4(t), 512(y), 512(x) |
| dtype | uint16 |
| source | ../../tests/data/1b_c16_15.tif |
| scale | ScaleView(t=1.0000, y=0.2000, x=0.2000) |
[29]:
def dmask0(im, erf_pvalue=1e-100, size=10):
p = utils.prob(im[0], *utils.bg(im[0]))
for img in im[1:]:
p = p * utils.prob(img, *utils.bg(img))
p = ndimage.median_filter((p) ** (1 / len(im)), size=size)
mask = p < erf_pvalue
return skimage.morphology.remove_small_objects(mask)
[30]:
dmask0(imar[1])
[30]:
array([[False, False, False, ..., False, False, False],
[False, False, False, ..., False, False, False],
[False, False, False, ..., False, False, False],
...,
[False, False, False, ..., False, False, False],
[False, False, False, ..., False, False, False],
[False, False, False, ..., False, False, False]], shape=(512, 512))
[31]:
plt.imshow(skimage.measure.label(mask))
[31]:
<matplotlib.image.AxesImage at 0x7a9714d77390>
[32]:
distance = skimage.filters.gaussian(distance, sigma=30)
tff.imshow(distance)
[32]:
(<Figure size 988.8x604.8 with 1 Axes>,
<Axes: >,
<matplotlib.image.AxesImage at 0x7a9714df9450>)

[33]:
np.transpose(np.nonzero(skimage.morphology.local_maxima(distance)))
[33]:
array([[ 3, 110, 353],
[ 3, 346, 107],
[ 3, 456, 18],
[ 3, 486, 128]])
[34]:
tff.imshow(ndimage.label(mask)[0])
[34]:
(<Figure size 988.8x604.8 with 2 Axes>,
<Axes: >,
<matplotlib.image.AxesImage at 0x7a9714d407d0>)

[35]:
res[1]
---------------------------------------------------------------------------
NameError Traceback (most recent call last)
Cell In[35], line 1
----> 1 res[1]
NameError: name 'res' is not defined
[36]:
res[2]["G"][2][0]
---------------------------------------------------------------------------
NameError Traceback (most recent call last)
Cell In[36], line 1
----> 1 res[2]["G"][2][0]
NameError: name 'res' is not defined
[37]:
res[1].plot()
---------------------------------------------------------------------------
NameError Traceback (most recent call last)
Cell In[37], line 1
----> 1 res[1].plot()
NameError: name 'res' is not defined
[38]:
import hvplot.pandas
[39]:
res[1].hvplot()
---------------------------------------------------------------------------
NameError Traceback (most recent call last)
Cell In[39], line 1
----> 1 res[1].hvplot()
NameError: name 'res' is not defined
[40]:
import xarray as xr
[41]:
xim = xr.DataArray(
data=[dim["G"], dim["R"], dim["C"]],
dims=["channel", "time", "y", "x"],
coords={
"channel": ["Green", "Red", "Cyan"],
"time": [0, 1, 2, 3],
"y": range(512),
"x": range(512),
},
)
[42]:
import hvplot.xarray
[43]:
xim.sel(time=0, channel="Green").hvplot(width=400, height=300)
[43]:
[44]:
xim.sel(time=0).hvplot(
width=300,
subplots=True,
by="channel",
)
[44]:
[45]:
hvplot.extension(
"bokeh",
"matplotlib",
)
[46]:
img = xim.sel(time=0).sel(channel="Red")
[47]:
hvimg = hv.Image(img)
[48]:
# %%opts Image [aspect=1388/1038]
f = xim.sel(channel="Red").hvplot(
frame_width=300,
frame_height=200,
subplots=True,
col="time",
yaxis=False,
colorbar=False,
xaxis=False,
cmap="Reds",
) + xim.sel(channel="Cyan").hvplot(
subplots=True, col="time", yaxis=False, colorbar=False, xaxis=False, cmap="Greens"
)
f
[48]:
[49]:
import aicsimageio
aicsimageio.__version__
---------------------------------------------------------------------------
ModuleNotFoundError Traceback (most recent call last)
Cell In[49], line 1
----> 1 import aicsimageio
3 aicsimageio.__version__
ModuleNotFoundError: No module named 'aicsimageio'
[50]:
reader = aicsimageio.readers.tiff_reader.TiffReader
aim1 = aicsimageio.AICSImage(
"/home/dati/dt-evolv/data/2022-06-17/images/Vero-Hek/2022-06-14/13080/TimePoint_1/6w-20Xph1-SpikeTest3_A02_s570_w14510D534-71A3-4EB5-B48F-F4331FE96517.tif",
reader=reader,
)
aim2 = aicsimageio.AICSImage(
"/home/dati/dt-evolv/data/2022-06-17/images/Vero-Hek/2022-06-14/13080/TimePoint_1/6w-20Xph1-SpikeTest3_A02_s570_w25049D5AC-5888-492F-891D-8BECC1AB67DF.tif",
reader=reader,
)
---------------------------------------------------------------------------
NameError Traceback (most recent call last)
Cell In[50], line 1
----> 1 reader = aicsimageio.readers.tiff_reader.TiffReader
2 aim1 = aicsimageio.AICSImage(
3 "/home/dati/dt-evolv/data/2022-06-17/images/Vero-Hek/2022-06-14/13080/TimePoint_1/6w-20Xph1-SpikeTest3_A02_s570_w14510D534-71A3-4EB5-B48F-F4331FE96517.tif",
4 reader=reader,
5 )
6 aim2 = aicsimageio.AICSImage(
7 "/home/dati/dt-evolv/data/2022-06-17/images/Vero-Hek/2022-06-14/13080/TimePoint_1/6w-20Xph1-SpikeTest3_A02_s570_w25049D5AC-5888-492F-891D-8BECC1AB67DF.tif",
8 reader=reader,
9 )
NameError: name 'aicsimageio' is not defined
[51]:
x1 = aim1.xarray_data
x2 = aim2.xarray_data
---------------------------------------------------------------------------
NameError Traceback (most recent call last)
Cell In[51], line 1
----> 1 x1 = aim1.xarray_data
2 x2 = aim2.xarray_data
NameError: name 'aim1' is not defined
[52]:
# Create a new Dataset with new coordinates
ds = xr.Dataset({"c1": x1, "c2": x2})
# Assuming ds is your Dataset
new_coords = {"Frame": [1, 2], "excitation_wavelength": [400, 500]}
# Use assign_coords to set new coordinates
ds_assigned = ds.assign_coords(**new_coords)
ds_assigned
---------------------------------------------------------------------------
NameError Traceback (most recent call last)
Cell In[52], line 2
1 # Create a new Dataset with new coordinates
----> 2 ds = xr.Dataset({"c1": x1, "c2": x2})
4 # Assuming ds is your Dataset
5 new_coords = {"Frame": [1, 2], "excitation_wavelength": [400, 500]}
NameError: name 'x1' is not defined
[53]:
aim2.metadata[220:230] == aim1.metadata[220:230]
---------------------------------------------------------------------------
NameError Traceback (most recent call last)
Cell In[53], line 1
----> 1 aim2.metadata[220:230] == aim1.metadata[220:230]
NameError: name 'aim2' is not defined
[54]:
im = x1.to_numpy()[0, 0, 0]
---------------------------------------------------------------------------
NameError Traceback (most recent call last)
Cell In[54], line 1
----> 1 im = x1.to_numpy()[0, 0, 0]
NameError: name 'x1' is not defined
[55]:
im1 = tff.imread("/home/dati/dt-evolv/data/2022-06-17/flat_w1.tif")
im2 = tff.imread("/home/dati/dt-evolv/data/2022-06-17/flat_w2.tif")
---------------------------------------------------------------------------
FileNotFoundError Traceback (most recent call last)
/tmp/ipykernel_2866/2721790190.py in ?()
----> 1 im1 = tff.imread("/home/dati/dt-evolv/data/2022-06-17/flat_w1.tif")
2 im2 = tff.imread("/home/dati/dt-evolv/data/2022-06-17/flat_w2.tif")
~/checkouts/readthedocs.org/user_builds/nima/envs/latest/lib/python3.13/site-packages/tifffile/tifffile.py in ?(files, selection, aszarr, key, series, level, squeeze, maxworkers, buffersize, mode, name, offset, size, pattern, axesorder, categories, imread, imreadargs, sort, container, chunkshape, chunkdtype, axestiled, ioworkers, chunkmode, fillvalue, zattrs, multiscales, omexml, superres, out, out_inplace, _multifile, _useframes, **kwargs)
1168 ):
1169 files = files[0]
1170
1171 if isinstance(files, str) or not isinstance(files, Sequence):
-> 1172 with TiffFile(
1173 files,
1174 mode=mode,
1175 name=name,
~/checkouts/readthedocs.org/user_builds/nima/envs/latest/lib/python3.13/site-packages/tifffile/tifffile.py in ?(self, file, mode, name, offset, size, omexml, superres, _multifile, _useframes, _parent, **is_flags)
4276 raise ValueError(msg)
4277 self._omexml = omexml
4278 self.is_ome = True
4279
-> 4280 fh = FileHandle(file, mode=mode, name=name, offset=offset, size=size)
4281 self._fh = fh
4282 self._multifile = True if _multifile is None else bool(_multifile)
4283 self._files = {fh.name: self}
~/checkouts/readthedocs.org/user_builds/nima/envs/latest/lib/python3.13/site-packages/tifffile/tifffile.py in ?(self, file, mode, name, offset, size)
13530 self._offset = -1 if offset is None else offset
13531 self._size = -1 if size is None else size
13532 self._close = True
13533 self._lock = NullContext()
> 13534 self.open()
13535 assert self._fh is not None
~/checkouts/readthedocs.org/user_builds/nima/envs/latest/lib/python3.13/site-packages/tifffile/tifffile.py in ?(self)
13550 msg = f'invalid mode {self._mode}'
13551 raise ValueError(msg)
13552 self._file = os.path.realpath(self._file)
13553 self._dir, self._name = os.path.split(self._file)
> 13554 self._fh = open( # noqa: SIM115
13555 self._file, self._mode, encoding=None
13556 )
13557 self._close = True
FileNotFoundError: [Errno 2] No such file or directory: '/home/dati/dt-evolv/data/2022-06-17/flat_w1.tif'
[56]:
%%opts Image [aspect=1388/1038]
%%opts Image.Cyan style(cmap=plt.cm.Blues)
%%opts Image.Green style(cmap=plt.cm.Greens)
%%opts Image.Red style(cmap=plt.cm.Reds)
/tmp/ipykernel_2866/1736577656.py:1: HoloviewsDeprecationWarning: IPython magic is deprecated and will be removed in version 1.23.0.
get_ipython().run_cell_magic('opts', 'Image [aspect=1388/1038]', '\n%%opts Image.Cyan style(cmap=plt.cm.Blues)\n%%opts Image.Green style(cmap=plt.cm.Greens)\n%%opts Image.Red style(cmap=plt.cm.Reds)\n')
[57]:
chans = (
hv.Image(dim["C"][0], group="cyan")
+ hv.Image(dim["G"][2], group="green")
+ hv.Image(dim["R"][1], group="red")
)
chans
[57]:
[58]:
hv.save(chans, "a.png")
---------------------------------------------------------------------------
RuntimeError Traceback (most recent call last)
Cell In[58], line 1
----> 1 hv.save(chans, "a.png")
File ~/checkouts/readthedocs.org/user_builds/nima/envs/latest/lib/python3.13/site-packages/holoviews/util/__init__.py:852, in save(obj, filename, fmt, backend, resources, toolbar, title, **kwargs)
850 from ..plotting.bokeh.util import silence_warnings
851 with silence_warnings(FIXED_SIZING_MODE):
--> 852 return renderer_obj.save(obj, filename, fmt=fmt, resources=resources, title=title)
853 return renderer_obj.save(obj, filename, fmt=fmt, resources=resources, title=title)
File ~/checkouts/readthedocs.org/user_builds/nima/envs/latest/lib/python3.13/site-packages/holoviews/plotting/renderer.py:599, in Renderer.save(self_or_cls, obj, basename, fmt, key, info, options, resources, title, **kwargs)
596 plot.layout.save(basename, embed=True, resources=resources, title=title)
597 return
--> 599 rendered = self_or_cls(plot, fmt)
600 if rendered is None: return
601 (_data, info) = rendered
File ~/checkouts/readthedocs.org/user_builds/nima/envs/latest/lib/python3.13/site-packages/holoviews/plotting/renderer.py:198, in Renderer.__call__(self, obj, fmt, **kwargs)
196 return self.static_html(plot), info
197 else:
--> 198 data = self._figure_data(plot, fmt, **kwargs)
199 data = self._apply_post_render_hooks(data, obj, fmt)
200 return data, info
File ~/checkouts/readthedocs.org/user_builds/nima/envs/latest/lib/python3.13/site-packages/holoviews/plotting/bokeh/renderer.py:127, in BokehRenderer._figure_data(self, plot, fmt, doc, as_script, **kwargs)
125 elif fmt == 'png':
126 from bokeh.io.export import get_screenshot_as_png
--> 127 img = get_screenshot_as_png(plot.state, driver=state.webdriver)
128 imgByteArr = BytesIO()
129 img.save(imgByteArr, format='PNG')
File ~/checkouts/readthedocs.org/user_builds/nima/envs/latest/lib/python3.13/site-packages/bokeh/io/export.py:275, in get_screenshot_as_png(obj, driver, timeout, resources, width, height, scale_factor, state)
272 raise ValueError(f'Expected the web driver to have a device pixel ratio greater than {scale_factor}. '
273 f'Was given a web driver with a device pixel ratio of {device_pixel_ratio}.')
274 else:
--> 275 web_driver = webdriver_control.get(scale_factor=scale_factor)
276 web_driver.maximize_window()
277 web_driver.get(f"file://{tmp.path}")
File ~/checkouts/readthedocs.org/user_builds/nima/envs/latest/lib/python3.13/site-packages/bokeh/io/webdriver.py:176, in _WebdriverState.get(self, scale_factor)
173 if not self.reuse or self.current is None or not scale_factor_less_than_web_driver_device_pixel_ratio(
174 scale_factor, self.current):
175 self.reset()
--> 176 self.current = self.create(scale_factor=scale_factor)
177 return self.current
File ~/checkouts/readthedocs.org/user_builds/nima/envs/latest/lib/python3.13/site-packages/bokeh/io/webdriver.py:180, in _WebdriverState.create(self, kind, scale_factor)
179 def create(self, kind: DriverKind | None = None, scale_factor: float = 1) -> WebDriver:
--> 180 driver = self._create(kind, scale_factor=scale_factor)
181 self._drivers.add(driver)
182 return driver
File ~/checkouts/readthedocs.org/user_builds/nima/envs/latest/lib/python3.13/site-packages/bokeh/io/webdriver.py:198, in _WebdriverState._create(self, kind, scale_factor)
195 self.kind = "firefox"
196 return driver
--> 198 raise RuntimeError("Neither firefox and geckodriver nor a variant of chromium browser and " \
199 "chromedriver are available on system PATH. You can install the former " \
200 "with 'conda install -c conda-forge firefox geckodriver'.")
201 elif driver_kind == "chromium":
202 return create_chromium_webdriver(scale_factor=scale_factor)
RuntimeError: Neither firefox and geckodriver nor a variant of chromium browser and chromedriver are available on system PATH. You can install the former with 'conda install -c conda-forge firefox geckodriver'.
5. Holoviews#
[59]:
hv.notebook_extension()
cm = plt.cm.inferno_r
channels = ["G", "R", "C"]
dim, n_ch, times = nima.read_tiff(fp, channels)
dimm = nima.d_median(dim)
f = nima.d_show(dimm, cmap=cm)
/tmp/ipykernel_2866/1764924339.py:1: HoloviewsDeprecationWarning: Calling 'hv.extension()' without arguments is deprecated and will be removed in version 1.23.0, use 'hv.extension("matplotlib")' instead.
hv.notebook_extension()

 ⓘ
ⓘ
(4, 512, 512)
[60]:
%%opts Image [aspect=512/512]
%%opts Image.Cyan style(cmap=plt.cm.Blues)
%%opts Image.Green style(cmap=plt.cm.Greens)
%%opts Image.Red style(cmap=plt.cm.Reds)
chans = hv.Image(dim['C'][0], group='cyan') \
+ hv.Image(dim['G'][0], group='green') \
+ hv.Image(dim['R'][0], group='red')
chans
/tmp/ipykernel_2866/3523771648.py:1: HoloviewsDeprecationWarning: IPython magic is deprecated and will be removed in version 1.23.0.
get_ipython().run_cell_magic('opts', 'Image [aspect=512/512]', "\n%%opts Image.Cyan style(cmap=plt.cm.Blues)\n%%opts Image.Green style(cmap=plt.cm.Greens)\n%%opts Image.Red style(cmap=plt.cm.Reds)\n\nchans = hv.Image(dim['C'][0], group='cyan') \\\n + hv.Image(dim['G'][0], group='green') \\\n + hv.Image(dim['R'][0], group='red')\n\nchans\n")
[60]:

[61]:
c = [(i, hv.Image(im)) for i, im in enumerate(dim["C"])]
c = hv.HoloMap(c, kdims=["Frame"])
g = [(i, hv.Image(im)) for i, im in enumerate(dim["G"])]
g = hv.HoloMap(g, kdims=["Frame"])
r = [(i, hv.Image(im)) for i, im in enumerate(dim["R"])]
r = hv.HoloMap(r, kdims=["Frame"])
[62]:
%%output holomap='auto'
%%opts Image style(cmap='viridis')
(c + g).select(Frame={0,5,6,7,10,30}).cols(2)
/tmp/ipykernel_2866/3640934118.py:1: HoloviewsDeprecationWarning: IPython magic is deprecated and will be removed in version 1.23.0.
get_ipython().run_cell_magic('output', "holomap='auto'", "%%opts Image style(cmap='viridis')\n(c + g).select(Frame={0,5,6,7,10,30}).cols(2)\n")
/tmp/ipykernel_2866/1261574846.py:1: HoloviewsDeprecationWarning: IPython magic is deprecated and will be removed in version 1.23.0.
get_ipython().run_cell_magic('opts', "Image style(cmap='viridis')", '(c + g).select(Frame={0,5,6,7,10,30}).cols(2)\n')
[62]:

[63]:
c[::20].overlay("Frame")
[63]:

[64]:
wl = hv.Dimension("excitation wavelength", unit="nm")
c = c.add_dimension(wl, 1, 458)
g = g.add_dimension(wl, 1, 488)
r = r.add_dimension(wl, 1, 561)
channels = c.clone()
channels.update(g)
channels.update(r)
[65]:
%%opts Image style(cmap='viridis')
%%output size=300
channels[::5].grid(['Frame', 'excitation wavelength'])
/tmp/ipykernel_2866/2279777199.py:1: HoloviewsDeprecationWarning: IPython magic is deprecated and will be removed in version 1.23.0.
get_ipython().run_cell_magic('opts', "Image style(cmap='viridis')", "%%output size=300\nchannels[::5].grid(['Frame', 'excitation wavelength'])\n")
/tmp/ipykernel_2866/3322840880.py:1: HoloviewsDeprecationWarning: IPython magic is deprecated and will be removed in version 1.23.0.
get_ipython().run_cell_magic('output', 'size=300', "channels[::5].grid(['Frame', 'excitation wavelength'])\n")
[65]:

[66]:
t = [(i, hv.Image(im)) for i, im in enumerate(dim["C"])]
[67]:
hv.HoloMap([(i, hv.Image(im)) for i, im in enumerate(dim["C"])], kdims=["frame"])
[67]:
[68]:
hv.NdLayout(
{
k: hv.HoloMap(
[(i, hv.Image(im)) for i, im in enumerate(dim[k])], kdims=["frame"]
)
for k in dim
},
kdims=["channels"],
)[::4]
[68]:
[69]:
%%opts Image (cmap='viridis')
%%opts Image.A [aspect=2]
im = hv.Image(dim["G"][1], bounds=(0, 0, 512, 512))
im2 = hv.Image(dim['C'][1], bounds=(0, 0, 512, 512))
im3 = hv.Image(dimm['C'][1], bounds=(0, 0, 512, 512))
((im * hv.HLine(y=350)) + im.sample(y=350) + (im2 * hv.HLine(y=150)) + im2.sample(y=150) * im3.sample(y=150)).cols(3)
/tmp/ipykernel_2866/4117421567.py:1: HoloviewsDeprecationWarning: IPython magic is deprecated and will be removed in version 1.23.0.
get_ipython().run_cell_magic('opts', "Image (cmap='viridis')", '%%opts Image.A [aspect=2]\nim = hv.Image(dim["G"][1], bounds=(0, 0, 512, 512))\nim2 = hv.Image(dim[\'C\'][1], bounds=(0, 0, 512, 512))\nim3 = hv.Image(dimm[\'C\'][1], bounds=(0, 0, 512, 512))\n((im * hv.HLine(y=350)) + im.sample(y=350) + (im2 * hv.HLine(y=150)) + im2.sample(y=150) * im3.sample(y=150)).cols(3)\n')
[69]:
